


A marine and two first responders from Onslow County, N.C. tried to get a military Humvee through a flooded area and had to be rescued. Onslow County has over 50% of its cell sites out of service.
Hurricane Florence restoration efforts in North Carolina in the past 24 hours brought the total of sites out of service to 11.8%, a 13% improvement over yesterday’s outages, according to the FCC’s Disaster Information Reporting System (DIRS) report for Sept. 17, 2018.
However, Onslow County saw a 31 % increase in new sites out of service, raising the county’s total to 115 cell sites not transmitting, representing 51% of its 227 total sites.
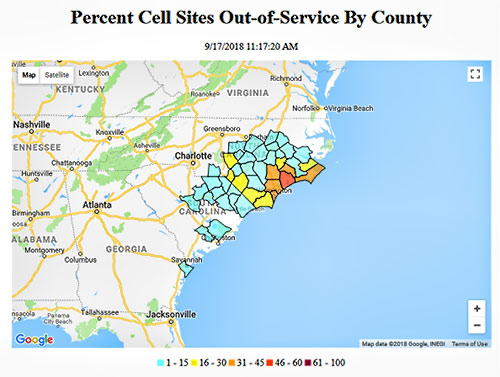 New Hanover County saw a 12% decrease in outages, but Wilmington has been cut off from ingress and egress by flooded roads and fuel resupply to generators is proving to be difficult. The county has 35% of its cell sites out of service, representing 99 of its 287 cell sites.
Many cell sites throughout the state are now operational after power was restored by Duke Energy and its partner affiliates.
Almost 670,000 people still remain without power in North Carolina as of Sunday, according to news reports.
“Our crews during the past 24 hours have made significant progress restoring power in areas of the Carolinas where it is safe to do,” Howard Fowler, Duke Energy incident commander, said in a statement.
He added: “In those hard-hit areas, total power restoration might take weeks, not days, due to widespread flooding and significant damage to power lines, utility poles and other key components of the electric grid.”
| North Carolina* | Total Cell Sites | 9/15/2018 | 9/16/2018 | 9/17/2018 | Decrease/ Increase |
| County | Percent Out | Percent Out | Percent Out | From 9/16/2018 | |
| Anson | 39 | 5.1 | 2.6 | 5.1 | 96% |
| Beaufort | 65 | 7.7 | 4.6 | 3.1 | -33% |
| Bladen | 75 | 44 | 21.3 | 14.7 | -31% |
| Brunswick | 238 | 24.8 | 32.8 | 27.3 | -17% |
| Carteret | 103 | 35 | 45.6 | 30.1 | -34% |
| Columbus | 92 | 33.7 | 18.5 | 19.6 | 6% |
| Craven | 201 | 33.3 | 19.9 | 12.9 | -35% |
| Cumberland | 390 | 27.4 | 15.1 | 13.3 | -12% |
| Duplin | 89 | 34.8 | 36 | 36 | 0% |
| Edgecombe | 47 | 14.9 | 2.1 | 2.1 | 0% |
| Greene | 45 | 20 | 8.9 | 6.7 | -25% |
| Harnett | 139 | 23 | 14.4 | 5.8 | -60% |
| Hoke | 52 | 19.2 | 13.5 | 7.7 | -43% |
| Johnston | 182 | 11 | 6.6 | 4.4 | -33% |
| Jones | 47 | 23.4 | 23.4 | 38.3 | 64% |
| Lee | 79 | 27.8 | 8.9 | 5.1 | -43% |
| Lenoir | 87 | 31 | 26.4 | 17.2 | -35% |
| Moore | 147 | 30.6 | 24.5 | 16.3 | -33% |
| Nash | 164 | 1.2 | 1.2 | 1.2 | 0% |
| New Hanover | 287 | 46.7 | 39 | 34.5 | -12% |
| Onslow | 227 | 37.9 | 38.8 | 50.7 | 31% |
| Pamlico | 19 | 15.8 | 10.5 | 15.8 | 50% |
| Pender | 89 | 34.8 | 32.6 | 31.5 | -3% |
| Pitt | 250 | 13.6 | 5.2 | 5.2 | 0% |
| Richmond | 101 | 17.8 | 12.9 | 0 | -100% |
| Robeson | 149 | 30.9 | 25.5 | 24.8 | -3% |
| Sampson | 103 | 43.7 | 19.4 | 10.7 | -45% |
| Scotland | 55 | 29.1 | 21.8 | 25.5 | 17% |
| Wake | 1131 | 4.2 | 1.4 | 1.3 | -7% |
| Wayne | 142 | 21.1 | 13.4 | 11.3 | -16% |
| *Counties with cell sites out of service | |||||

