|
Start spreading the news
New York reigns again as the king of the highest priced wireless construction projects in the nation in the nation
August 4, 2006 - Successful wireless construction contractors know the problems, delays and added costs required when providing services in New York City and agree with Frank Sinatra's inimitable advice, "If I can make it there, I'll make it anywhere."
Unfortunately, startup companies that are unaware of Gotham's price gouging for labor and materials when they bid projects end up singing the little town blues as they watch their anticipated profit head south.
|
Highest Priced Construction Cities
|
|
City 
|
State
|
Material
Percentage
|
Installation
Percentage
|
Weighted Average Percentage
|
| San Francisco |
CA |
8.4 |
44.2 |
24.8 |
| Far Rockaway |
NY |
3.7 |
50.7 |
24.9 |
| Staten Island |
NY |
2.8 |
52.8 |
25.2 |
| Fairbanks |
AK |
23.8 |
26.9 |
25.2 |
| Boston |
MA |
3.3 |
53.9 |
25.4 |
| Honolulu |
HI |
19.4 |
33.6 |
25.7 |
| Queens |
NY |
3.2 |
56.3 |
27.4 |
| Ozone Park |
NY |
2.8 |
58.3 |
28.5 |
| Flushing |
NY |
3.7 |
59.3 |
29.0 |
| Anchorage |
AK |
25.5 |
33.5 |
29.6 |
| Long Island |
NY |
3.6 |
72.9 |
34.9 |
| New York City |
NY |
5.0 |
61.6 |
36.5 |
|
Lowest Priced Construction Cities
|
City  |
State |
Material
Percentage
|
Installation
Percentage
|
Weighted Average Percentage
|
| West Memphis |
TN |
-3.7 |
-37.9 |
-20.7 |
| McAllen |
TX |
-2.5 |
-41.7 |
-20.8 |
| Kinston |
NC |
-2.8 |
-43.4 |
-20.9 |
| Somerset |
KY |
-3.7 |
-38.9 |
-20.9 |
| Greenville |
MS |
-1.9 |
-42.7 |
-20.9 |
| Beaufort |
SC |
-2.0 |
-46.9 |
-20.9 |
| Brownwood |
TX |
-2.8 |
-44.3 |
-21.3 |
| Harrison |
AR |
-4.1 |
-43.1 |
-21.5 |
| Liberal |
KS |
-1.4 |
-43.9 |
-22.2 |
| Hot Springs |
AK |
-4.3 |
-43.8 |
-22.2 |
| Adams |
OK |
-3.4 |
-46.6 |
-22.7 |
| Del Rio |
TX |
-2.8 |
-50.5 |
-24.2 |
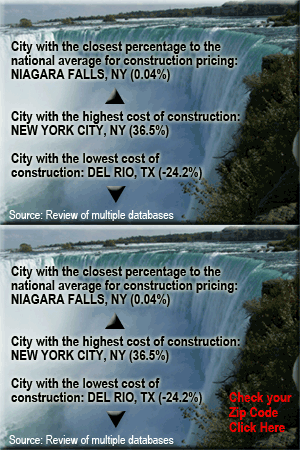
Once again, New York has been identified as having the highest construction costs of any city in America with a weighted average of 37% above the national average of commercial construction project outlays, according to available databases reviewed by WirelessEstimator.com.
Contractors will find that if they want to discover if their project will play in Peoria it will cost them 1.5% more; and the city by the bay will extract an additional 25% in expenses.
For a complete listing of sectional zip codes throughout the nation and the city's ranking, see: Variances By Zip .
Variances should be carefully weighed
There are times when contractors need to consider pricing modifications in each area of the country and decide if it influences their cost of construction.
Many multi-location bids require pricing escalations or decreases for each state. Seasoned estimators will identify a baseline price for each scope of work and escalate their pricing as necessary for the location by using area modification factors.
Professional tower erection, antenna and line installation and other crafts specifically related to wireless construction are typically not affected by these modifiers due to industry requirements to provide highly skilled technicians in addition to maintaining high safety standards and the proper insurance coverage.
In addition, contractors would not anticipate seeing a material increase for products such as towers, accessories, equipment buildings and other common components that are not locally obtained.
However, in using local labor and commodities, it's important to assess geographic pricing so that contractors can be obtained for the amount budgeted.
A recent WirelessEstimator.com poll had one third of 409 respondents indicate that site development, crafts that are reflected by highly fluctuating prices from state to state as well as cities, was an area where they typically saw higher pricing than the amounts that they estimated.
It's Oh Canada, not low Canada
|
Canadian Modification Factors*
|
|
Material
Percentage
|
Installation
Percentage
|
Weighted
Average
Percentage
|
| Alberta |
38.5 |
14.6 |
27.9 |
| British Columbia |
38.3 |
16.8 |
29.4 |
| Manitoba |
39.3 |
11.2 |
26.9 |
| New Brunswick |
34.2 |
4.4 |
21.1 |
| Newfoundland |
36.8 |
2.8 |
21.9 |
| Nova Scotia |
36.8 |
11.1 |
25.8 |
| Ontario |
36.6 |
18.9 |
28.7 |
| Quebec |
37.0 |
19.3 |
29.3 |
| Saskatchewan |
35.6 |
9.6 |
24.1 |
|
*Based in US Dollars using a 8/4/06 exchange rate of .887 Canadian
|
You'll be incorrect if you think it will be greener across our northern border. Canada's material and installation pricing, based upon the current exchange rate, is considerably higher than most states in the U.S.
A total weighted average of 36% more for local commodities and labor in U.S. currency will greet contractors desiring to perform projects in Canada.
Down Mexico way is way down
If you are going south of the border you'll find that pricing is considerably lower than all states in the U.S. Although some carriers and tower owners have stringent design and quality standards, Mexico is awash in inadequate structures that exceeded capacity when they were built.
|