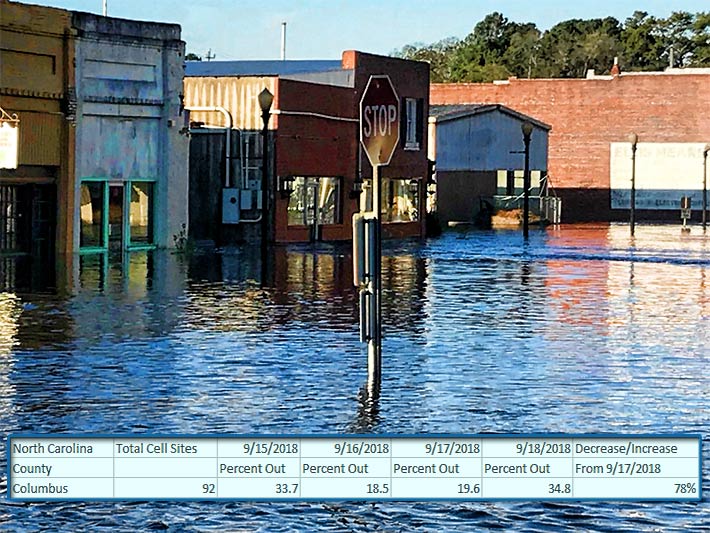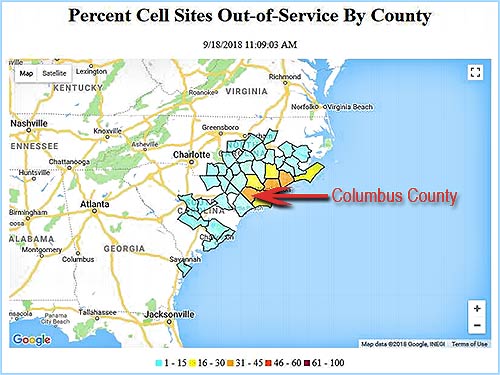
Main St. in Fair Bluff, NC is one of Columbus County’s communities severely flooded and cut off from resources. Cell site outages in the county rose to 35% yesterday.
Hurricane Florence restoration efforts in North Carolina have brought the total of sites out of service to 8%, a 32% improvement over yesterday’s outages, according to the FCC’s Disaster Information Reporting System (DIRS) report for Sept. 18, 2018.
However, Columbus County, hard-hit in the past couple of days by massive flooding, saw a 78 % increase in new sites out of service, raising the county’s total to 32 cell sites not transmitting, representing 34.8% of its 92 total sites.
 Columbus County officials say the major flooding that has inundated the area since Hurricane Florence has affected areas that did not flood after Hurricane Matthew two years ago.
Tabor City, areas along the Lumber River, Fair Bluff, Lake Waccamaw, Boardman, Riegelwood and Delco have all experienced life-threatening flooding the county said in a news release.
South Carolina remains unscathed
Cell sites in South Carolina were largely unaffected by the hurricane, and the 19 that are down, representing 0.5% of the state’s 4,107 total, would be an amount that could be expected on any given day.
The number of cell site outages in a specific area does not necessarily correspond to the availability of wireless service to consumers in that area. Networks are often designed with numerous, overlapping cell sites that provide maximum capacity and continuity of service even when an individual site is inoperable.
In addition, wireless providers frequently use temporary facilities and have roaming agreements or take other actions to maintain service to affected consumers during emergencies or other events that result in cell site outages.
| North Carolina* | Total Cell Sites | 9/15/2018 | 9/16/2018 | 9/17/2018 | 9/18/2018 | Decrease/ Increase |
| County | Percent Out | Percent Out | Percent Out | Percent Out | From 9/17/2018 | |
| Anson | 39 | 5.1 | 2.6 | 5.1 | 4.3 | -16% |
| Beaufort | 65 | 7.7 | 4.6 | 3.1 | 1.5 | -52% |
| Bladen | 75 | 44 | 21.3 | 14.7 | 17.3 | 18% |
| Brunswick | 238 | 24.8 | 32.8 | 27.3 | 23.9 | -12% |
| Carteret | 103 | 35 | 45.6 | 30.1 | 21.4 | -29% |
| Columbus | 92 | 33.7 | 18.5 | 19.6 | 34.8 | 78% |
| Craven | 201 | 33.3 | 19.9 | 12.9 | 10.4 | -19% |
| Cumberland | 390 | 27.4 | 15.1 | 13.3 | 5.6 | -58% |
| Duplin | 89 | 34.8 | 36 | 36 | 23.6 | -34% |
| Edgecombe | 47 | 14.9 | 2.1 | 2.1 | 0 | -100% |
| Greene | 45 | 20 | 8.9 | 6.7 | 0 | -100% |
| Harnett | 139 | 23 | 14.4 | 5.8 | 4.3 | -26% |
| Hoke | 52 | 19.2 | 13.5 | 7.7 | 5.8 | -25% |
| Johnston | 182 | 11 | 6.6 | 4.4 | 1.6 | -64% |
| Jones | 47 | 23.4 | 23.4 | 38.3 | 14.9 | -61% |
| Lee | 79 | 27.8 | 8.9 | 5.1 | 0 | -100% |
| Lenoir | 87 | 31 | 26.4 | 17.2 | 14.9 | -13% |
| Moore | 147 | 30.6 | 24.5 | 16.3 | 4.1 | -75% |
| Nash | 164 | 1.2 | 1.2 | 1.2 | 0.6 | -50% |
| New Hanover | 287 | 46.7 | 39 | 34.5 | 27.2 | -21% |
| Onslow | 227 | 37.9 | 38.8 | 50.7 | 31.3 | -38% |
| Pamlico | 19 | 15.8 | 10.5 | 15.8 | 0 | -100% |
| Pender | 89 | 34.8 | 32.6 | 31.5 | 30.3 | -4% |
| Pitt | 250 | 13.6 | 5.2 | 5.2 | 5.2 | 0% |
| Richmond | 101 | 17.8 | 12.9 | 0 | 3.6 | 100% |
| Robeson | 149 | 30.9 | 25.5 | 24.8 | 6 | -76% |
| Sampson | 103 | 43.7 | 19.4 | 10.7 | 8.7 | -19% |
| Scotland | 55 | 29.1 | 21.8 | 25.5 | 7.3 | -71% |
| Wake | 1131 | 4.2 | 1.4 | 1.3 | 0.9 | -31% |
| Wayne | 142 | 21.1 | 13.4 | 11.3 | 6.3 | -44% |
| *Counties with cell sites out of service | ||||||


